Corporate bonds in Kenya are debt securities issued by private companies to raise capital. Investors lend money to these companies in exchange for regular interest payments and repayment of the bond’s face value at maturity. They’re traded on the Nairobi Securities Exchange (NSE) and are regulated by the Capital Markets Authority (CMA). Corporate bonds offer investors an alternative to government securities, potentially yielding higher returns but with higher risks associated with the issuing company’s creditworthiness. Before investing, investors consider factors like the company’s financial health, bond terms, and market conditions.
The Board of Trustees reassures you the financial market’s volatility are cyclical and that both Scheme’s strategies have modelled a long-term investment approach that accounts for short-term effects on the investment fund. We hold the belief to ensure a sustainable kitty to all Scheme Members.
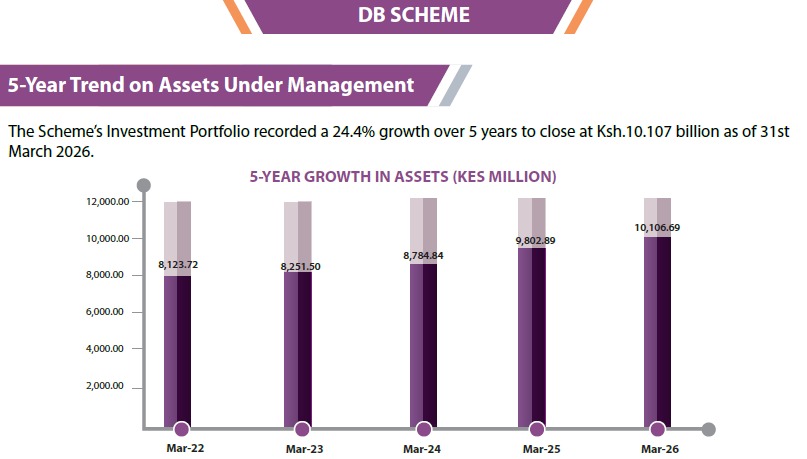
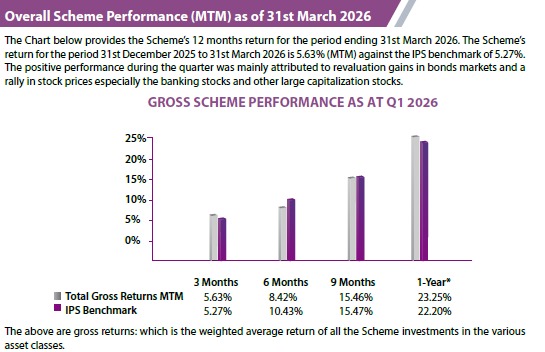
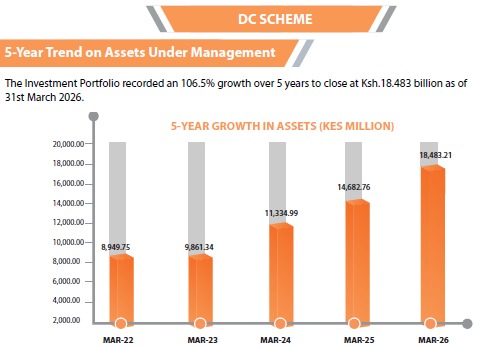
The following charts provide the distribution of the investments based on portfolio allocation and market value of investments.
Defined Benefits Scheme
Asset Allocation
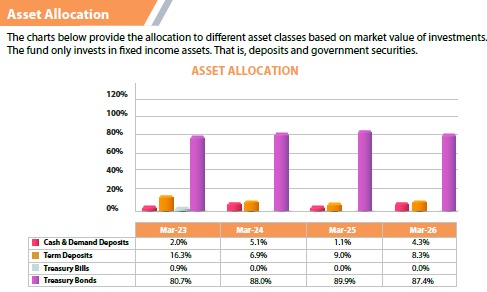
The charts below provide the allocation to different asset classes based on market value of investments.
Defined Contributions Scheme
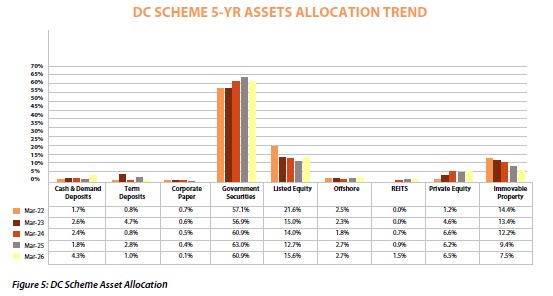
Asset Allocation
The charts below provide the allocation to different asset classes based on market value of investments. All Scheme assets are compliant with the IPS limit. We continuously restructure the portfolio and aim to diversify to investments with high returns that’s within the permissible risks as per the 10-year strategy.