Government securities are issued by the government to raise funds from public and institutional investors with promise to pay back the principal amount borrowed plus interest. There are mainly two types: Treasury bills (Short term between 91 days to 1 year) and Treasury bonds (Long term between 2 years to 30 years). They’re considered safe because they’re backed by the government. The government uses the proceeds from the sale of these securities to finance its budgetary needs, fund infrastructure projects, and manage its debt obligations.
The Board of Trustees reassures you the financial market’s volatility are cyclical and that both Scheme’s strategies have modelled a long-term investment approach that accounts for short-term effects on the investment fund. We hold the belief to ensure a sustainable kitty to all Scheme Members.
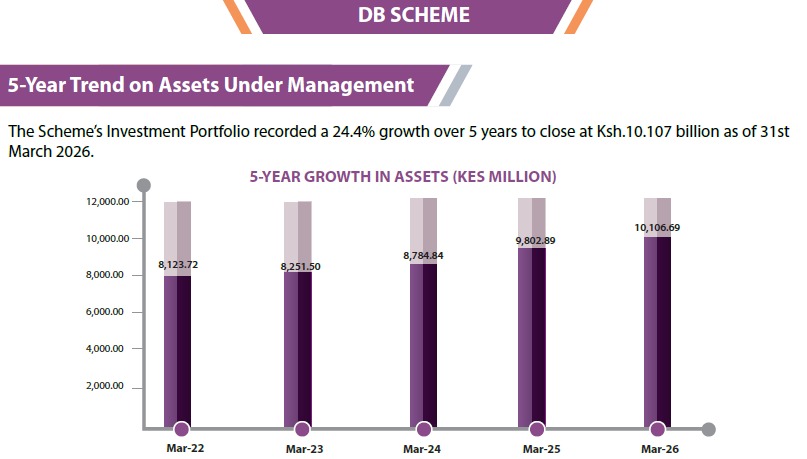
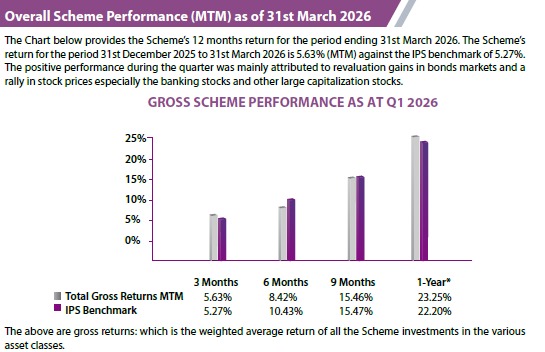
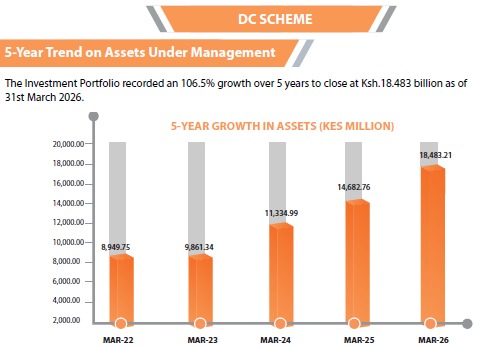
The following charts provide the distribution of the investments based on portfolio allocation and market value of investments.
Defined Benefits Scheme
Asset Allocation
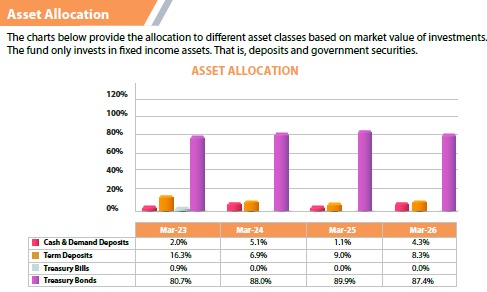
The charts below provide the allocation to different asset classes based on market value of investments.
Defined Contributions Scheme
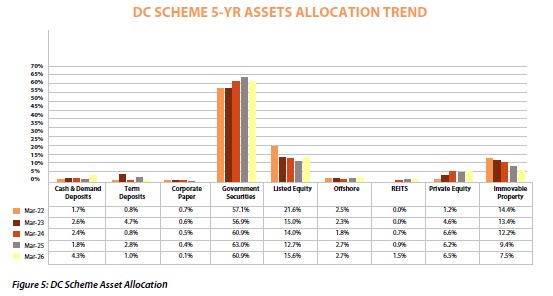
Asset Allocation
The charts below provide the allocation to different asset classes based on market value of investments. All Scheme assets are compliant with the IPS limit. We continuously restructure the portfolio and aim to diversify to investments with high returns that’s within the permissible risks as per the 10-year strategy.